The top five producers of plastic waste depend on the dataset and measurement method. For total municipal plastic waste in the 2020 data presented by Our World in Data, China and India rank highest, followed by the United States, Brazil, and Indonesia. A ranking based on per-capita waste, industrial waste, plastic exports, or environmental leakage will produce different results.
Why the Question Needs a Clear Definition
“Plastic waste producer” may refer to a country that generates the most discarded plastic, a country with the highest waste per person, or a country whose waste is most likely to enter the environment.
These categories should not be mixed:
Total plastic waste is strongly influenced by population and plastic consumption.
Per-capita waste measures average waste generated by each resident.
Mismanaged waste refers to material not handled through controlled systems.
Plastic pollution measures waste released into the environment.
Plastic-waste exports track material shipped to other countries.
A country can generate a large amount of plastic waste while controlling most of it through collection. Another country may generate less total waste but have a greater proportion that is openly burned, dumped, or leaked.
The Five Largest Total Municipal-Waste Producers
Using the 2020 municipal plastic-waste dataset from Cottom and colleagues, presented by Our World in Data, the largest total generators are:
China
India
United States
Brazil
Indonesia
This dataset covers waste from households, shops, offices, and similar municipal sources. It does not include every industrial, construction, agricultural, or fishing-related plastic stream.
Older datasets may place the United States first. The difference is not necessarily an error; the year, coverage, methodology, and treatment of exports or uncollected waste may have changed.
Total Waste Is Not the Same as Per-Capita Waste
Large countries naturally appear near the top of total-waste rankings because they have more residents. When data is divided by population, high-income economies often generate much more plastic waste per person.
This distinction changes the policy question. Total figures show where recycling infrastructure must handle the greatest volume. Per-capita figures show where consumption patterns may be especially intensive.
Both measures are useful, but neither alone explains plastic pollution.
Why Recycling Rates Remain Limited
Plastic waste contains many polymers, colors, additives, labels, coatings, and contaminants. Mixed materials are harder to sort and may not produce recycled pellets with predictable properties.
Collection and sorting costs also affect recycling economics. Virgin resin may remain cheaper or more consistent for some applications, reducing demand for recycled material.
The OECD reported that only a relatively small share of global plastic waste is recycled. Under current-policy projections, plastic waste could almost triple by 2060, while recycled plastics would still represent a limited share of total feedstock.
What Makes Waste Suitable for Pelletizing?
Before mechanical recycling, waste should be separated by polymer as accurately as possible. PP, PE, PET, ABS, PC, pmma, PA, and PBT have different processing temperatures and behaviors.
The material should then be evaluated for:
Clean factory offcuts are generally easier to recycle than mixed post-consumer waste. Transparent PC and PMMA need careful control to limit discoloration and preserve useful properties.
Converting Plastic Waste Into Reusable Pellets
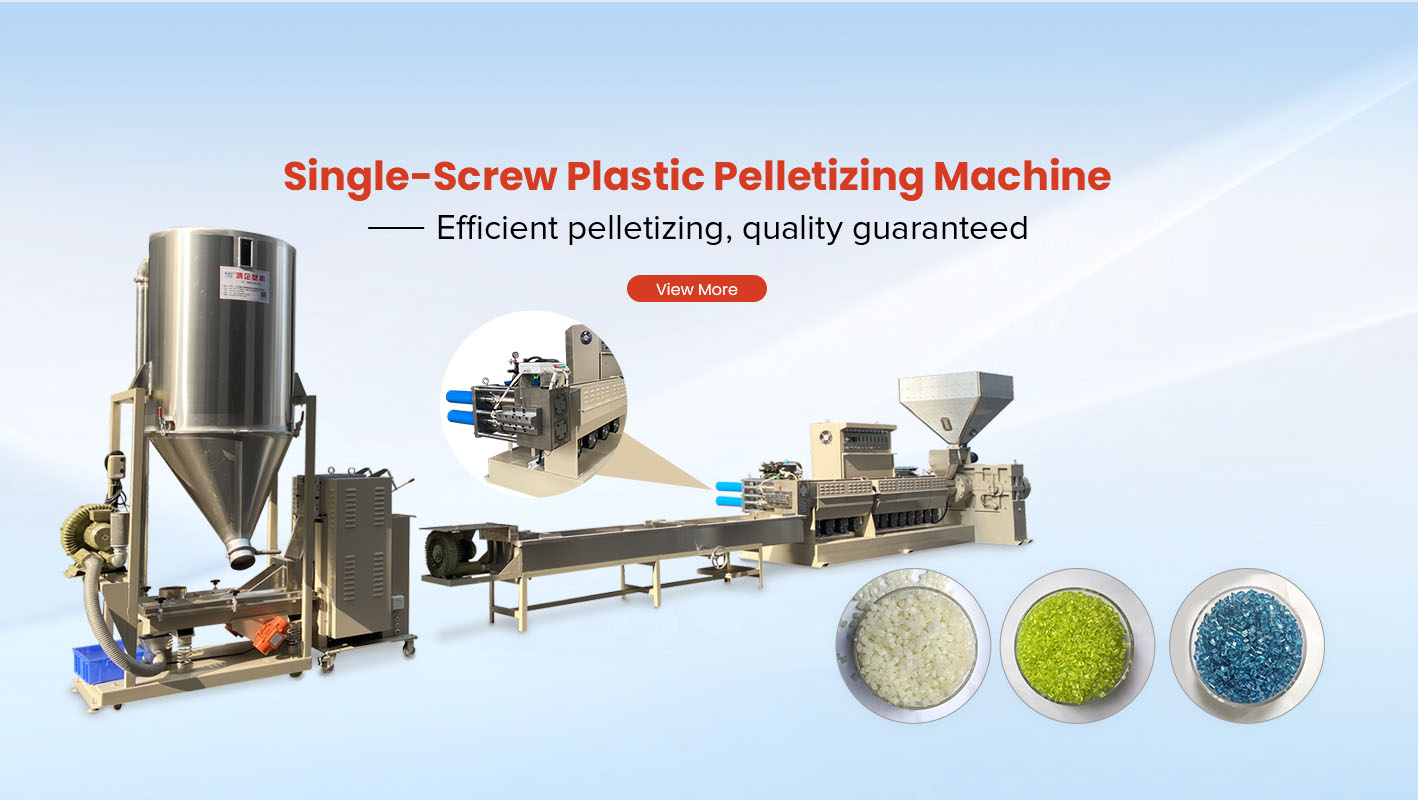
Mechanical pelletizing gives prepared waste a more consistent form for storage, dosing, transportation, and reuse. The material is conveyed, melted, filtered, extruded, cooled, cut, and screened.
Our plastic waste recycling equipment bulk supply includes single-screw and twin-screw extruders, mixers, Screw Conveyors, dewatering machines, de-coating equipment, Strand Pelletizers, vibrating screens, and Spare Parts.
Rather than supplying an isolated extruder, we can plan the sequence according to waste form and processing needs. More than 20 years of pelletizing experience supports recycling solutions for general plastics and engineering materials.
Equipment cannot solve poor sorting by itself. Its role is to process an appropriately prepared stream with stable temperature, pressure, filtration, and cutting conditions.
Rankings Should Lead to Better Processing Decisions
A top-five list shows the scale of the global issue, but recycling decisions happen at material-stream level. A plant needs to know what plastic it receives, how contaminated it is, and what the recycled pellet will be used for.
That information determines whether the process needs washing, de-coating, intensive drying, fine filtration, stronger mixing, or another treatment stage.
Evaluate Your Plastic Waste Stream
Share the polymer types, source of waste, contamination, moisture, target capacity, and pellet application. We can assess the necessary processing stages and prepare a bulk equipment supply plan.